3.6.25 Other vegetable saps and extracts – Price Values and Quantity by Year from 2000 to 2007
3.6.25.1 Overview
| Scientific name: | N/A |
| Common name: | Vegetable saps, extracts |
| Plant part used: | Saps, exudates, extracts |
| HS Code: | 130219000 |
| SITC Code: | 292949000 |
3.6.25.2 Analysis
Other vegetable saps and extracts comprise of a number of products such as extract of hops and extracts of liquorice. They have medicinal uses and also other applications such as in cosmetics and the like. There was a sudden surge in quantities exported in year 2001 whilst the amounts remained low in the other years. There was no clear indication as to whether the trade in on the increasing or decreasing trends. Yearly amounts exported were moderate ranging from 4,960 kg to 323,006 kg. The profile for export revenues, indicated a contrasting situation with the revenue, reaching its peak in year 2006 at a value of about RM2.417 million. The lowest export earning was recorded in year 2005 at RM120,721. The cost per kg of product did not influence the quantity exported as seen in years 2005 and 2006 when the unit costs were at RM24.34 and RM48.09 respectively. The unit cost profile indicated an increasing trend from year 2000 to 2006, but dropped in year 2007.
Looking at the differences between the unit costs of the product exported and imported throughout the years, the result and values were in the negative ,except for year 2006. Although there could be many factors contributing to this situation, price competition in the international market played a significant role.
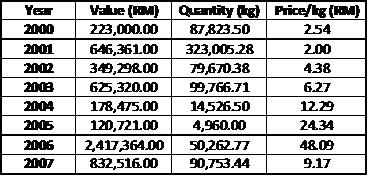
Table 111: Summary of export volumes and values
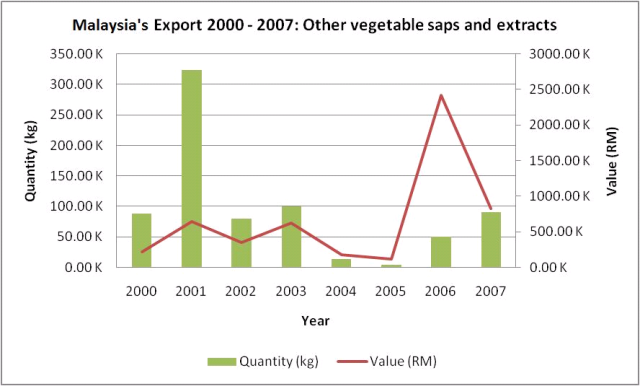
Figure 161: Malaysia’s export 2000 – 2007 for Other vegetable saps and extracts
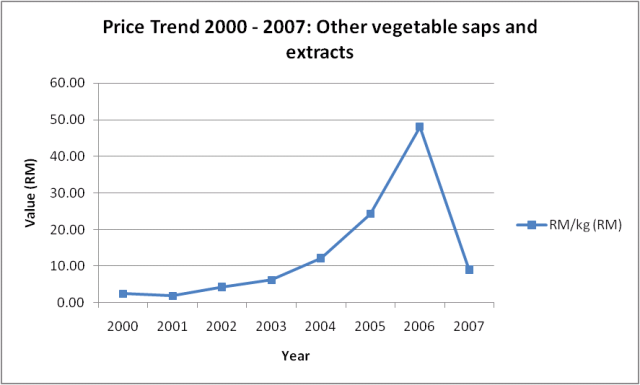
Figure 162: Exported other vegetable saps and extracts price trend 2000 – 2007
| Year | Export(RM) | Import (RM) | Diff(RM) |
| 2000 | 2.54 | 25.37 | -22.83 |
| 2001 | 2.00 | 29.5 | -27.5 |
| 2002 | 4.38 | 30.49 | -26.11 |
| 2003 | 6.27 | 43.17 | -36.9 |
| 2004 | 12.29 | 41.17 | -28.88 |
| 2005 | 24.34 | 29.99 | -5.65 |
| 2006 | 48.09 | 24.75 | 23.34 |
| 2007 | 9.17 | 40.08 | -30.91 |
Table 112: Export and Import Unit Cost Differences of Herbal Products 2000 -2007